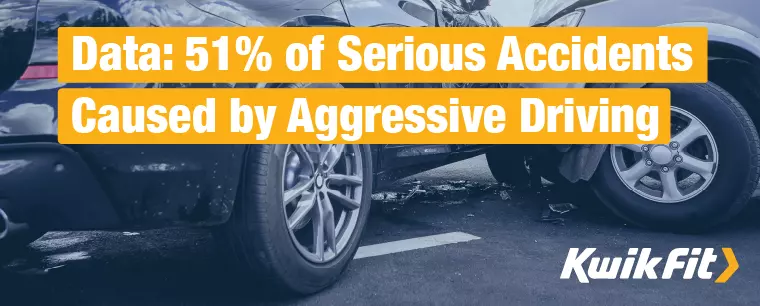
Collision Data Analysed: 51% of Serious Accidents Caused by Aggressive Driving
Jack Dreyer | Monday 29th May 2023 8:00am
We work every day to keep you safe on Britain’s roads. From brakes, to tyres, to full-blown servicing, our expert technicians work hard to keep your car in the best condition possible for as long as possible – so we were quite happy to find that it seems to be working!
We analysed government collision data from the last decade to find out the breakdown of collision causes as well as how these have changed over time.
It’s worth mentioning here that this is data collated from police forces around the UK, so only contains numbers from collisions which were bad enough to warrant police officers attending the scene. So, at present, this data only represents collisions in which someone was killed or seriously injured (KSI).
Summary findings
The good news is that, in 2021, only 2.10% of collisions were found to have vehicle defects as a contributory factor, up only marginally from 2.06% in 2012. While, of course, we’d rather that no collisions had vehicle defects attributed to them, there will always be a component that breaks unexpectedly or a driver who fails to maintain that component. Such a low percentage indicates that, on the whole, the UK’s drivers are doing a great job of maintaining their vehicles.
A significantly concerning element in the data is that an amazing 60% of serious collisions were caused by Driver Error – with over half of these being due to the driver simply failing to look properly. Something that should be much lower considering it only takes an extra moment to verify that the road is clear. But everyone makes mistakes; by far the most concerning statistic is that almost 51% of collisions in which someone was killed or seriously injured were caused by aggressive or careless driving, by tailgating, or by speeding.
These last few are worrying because they can’t be explained away as accidents, they’re not simply bad luck but are due to wilful action.
Let’s look at a breakdown of some of the contributory factors.
Collision data headlines
These headline figures represent the statistics from 2021, unless specified otherwise. Bear in mind here that collisions usually have more than one contributory factor so these don’t add up to 100%. Overly worn brakes, for example, can contribute to a collision at times when the driver is speeding or not paying attention to the road conditions.
The more we know about what causes serious collisions, the more can be done to avoid them.
Road environment – 11.26%
As you may expect, the conditions of the road accounted for a significant portion of serious collisions. The main factor here was the road being slippery due to weather (5.81%) but things like debris, temporary road layout (for example, due to roadworks), or a defective road surface (such as due to a pothole) were all contributory factors.
| Factor | % of collisions factor contributed to |
|---|---|
| Slippery road (due to weather) | 5.81% |
| Road layout (eg. bend, hill, narrow road) | 2.43% |
| Animal or object in carriageway | 1.11% |
| Deposit on road (eg. oil, mud, chippings) | 1.08% |
Vehicle defects – 2.10%
Vehicle defects of various kinds accounted for only 2.1% of serious collisions, but almost half of these were due to defective brakes and a quarter were due to overly worn or improperly inflated tyres. This means that regular MOTs, and the work of technicians such as the experts at Kwik Fit, are helping to keep serious collisions down.
| Factor | % of collisions factor contributed to |
|---|---|
| Defective brakes | 0.84% (up from 0.64% in 2012) |
| Defective tyres | 0.55% (down from 0.85% in 2012) |
Injudicious action or aggressive driving – 50.46%
One of the most significant factors leading to collisions is aggressive or careless driving and exceeding speed limits.
Quite a significant number – just under a quarter – of collisions in 2021 were caused by what’s called ‘injudicious action’. This includes illegal or otherwise unwise actions like disobeying traffic signals, ignoring pedestrian crossings, or driving along a pavement.
By far the biggest portion of these accidents were caused by drivers exceeding the speed limit, with 10% leading to a serious incident (up from 5.99% in 2012). Travelling too fast for the given conditions was not far behind at 6.71%.
All this goes to show the importance of knowing the Highway Code, having a grip on stopping distances, and obeying road speed signs – however slow they may sometimes feel.
| Factor | % of collisions factor contributed to |
|---|---|
| Careless, reckless, or hurried driving | 19.90% |
| Exceeding speed limit | 10.03% (up from 5.99% in 2012) |
| Travelling too fast for conditions | 6.71% |
| Aggressive driving | 5.45% |
| Learner or inexperienced driver | 4.04% |
| Skipping lights or disobeying signs | 3.82% |
| Tailgating | 2.45% |
Driver/rider error or reaction – 60.30%
A shocking 60% of collisions in which people were killed or seriously injured were found to have driver error as a contributory cause – with 32% of these caused by drivers failing to look properly. This is down from 67.52% in 2012 but is still present in an overwhelming majority of serious collisions – accounting for 13,345 cases in 2021.
| Factor | % of collisions factor contributed to |
|---|---|
| Failed to look properly | 31.66% |
| Misjudged other person’s path or speed | 16.01% |
| Poor turn or manoeuvre | 10.97% |
| Loss of control | 13.93% |
Impairment or distraction – 20.40%
Impairment due to alcohol or drugs (including medicinal drugs) accounted for 20.4% of collisions. The majority of these would have been driving under the influence of alcohol, but distraction within the vehicle – from mobile phones, for example – was a contributory factor in 3.4% of collisions.
Notably, the whole category here is up significantly from 14.88% in 2012 – likely due to the huge increase in in-car infotainment phone-integrated dashboards.
| Factor | % of collisions factor contributed to |
|---|---|
| Driver impaired by alcohol or drugs (incl. medicinal) | 12.57% |
| Distraction in vehicle | 3.40% (up from 2.53% in 2012) |
Vision affected by external factors – 9.16%
This category covers largely external conditions that affect vision rather than affect things like stopping distance. The main factors here were drivers being dazzled due to sun or headlights, or otherwise having their vision impaired by rain, sleet, snow, and fog. Stationary or parked vehicles, as well as blind spots specific to the driver’s car, were also contributing factors.
| Factor | % of collisions factor contributed to |
|---|---|
| Dazzling sun or rain, sleet, etc | 4.14% |
| Stationary/parked vehicles | 2.18% |
| Vehicle blind spot | 1.31% |
Pedestrian only – 13.15%
In 2012, 18.29% of serious collisions could be attributed - at least in part - to pedestrians, be that because of error, inebriation, or careless behaviour. The good news is that this has decreased in the last 10 years, with 13.15% of accidents reported to police listing pedestrian behaviour as a contributing factor.
Most of these incidents (7.84%) were due to failure on the part of the pedestrian to look properly.
Perhaps this indicates a need for more pedestrian education or even signage. After all, we expect drivers to know the Highway Code and pass a test, but not everyone has a driving licence (only 74% of those over 17 years of age do) and road markings are often unclear for drivers, let alone pedestrians.
| Factor | % of collisions factor contributed to |
|---|---|
| Pedestrian failed to look properly | 7.84% (down from 13.87% in 2012) |
| Pedestrian impaired by alcohol | 1.81% |
| Pedestrian careless, reckless or in a hurry | 3.09% |
| Pedestrian wearing dark clothing at night | 1.04% |
Safe cars, safe roads
While clearly a lot needs to be done to address the problem of aggressive and careless driving, it’s great news that drivers are - for the most part - maintaining their vehicles properly.
Keep your vehicle in the best shape possible with the expert technicians at your local Kwik Fit centre.
Any facts, figures and prices shown in our blog articles are correct at time of publication.
Featured Articles
Is it Illegal to Drive With One Headlight?
Saturday 19th July 2025

Wondering if it’s illegal to drive with one headlight? Learn about the safety risks and penalties of illegal blown bulbs and why you should fix them promptly.
Air Con in EVs & Hybrids: Experts Answer Your Questions
Monday 30th June 2025

Does air con drain EV batteries? Can you use the air con while charging an electric car? Find out the answers to these questions & more from Kwik Fit’s experts.
Why Is Your Car Making a Noise? Fixes & Tips
Friday 13th June 2025

When your car starts making unexpected noises, it can certainly be quite disconcerting; it may be nothing to worry about, but here’s what you need to know.