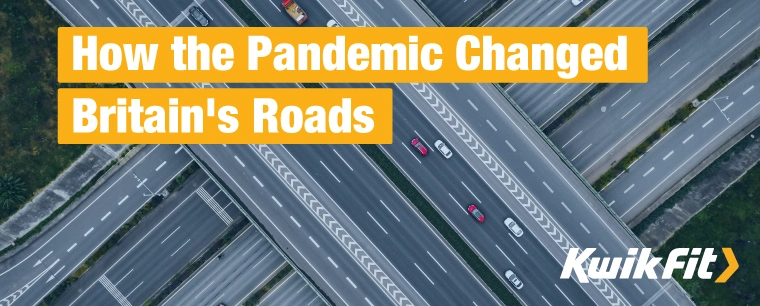
How the Pandemic Changed Britain's Roads
Jack Dreyer | Monday 6th November 2023 9:00am
2020: The year the roads went quiet. During the numerous lockdown periods across the UK, cars and other vehicles remained parked on driveways for weeks at a time. And, for the most part, Britain’s roads got very quiet indeed.
But have the traffic levels on our roads recovered since? And, have there been any significant changes to Britain’s travel patterns as a result of the COVID-19 pandemic?
Now that we’re far enough away from the start of the pandemic to see it in hindsight, it’s a lot easier to spot trends and travel patterns. If you’re keen to learn more about the long and short-term impacts of COVID on Britain’s roads, read on.
Pandemic traffic levels: The facts & figures
As one of the UK’s leading motoring companies, we were naturally interested to see just how much of an impact COVID actually had on the amount and type of traffic on Britain’s roads. As such, we examined the official road statistics from The Department for Transport and found the following trends.
Motor vehicle traffic has only just returned to pre-pandemic levels
Motor traffic in 2022
As the pandemic restrictions eased from 2021 to 2022, the amount of traffic on Britain’s roads increased, as expected, by 8.8%. And yet, the total amount of traffic on Britain’s roads in 2022 was still 4.4% lower than pre-pandemic levels in 2019.
Motor traffic in 2023
However, in 2023, there was a definite rise in the number of motor vehicles back on the roads. Figures released by the Department for Transport in October 2023 reveal that, as of the 9th of October, car traffic volumes were 99% of the levels they were during the first week of February 2020 before the pandemic began. This signals an almost complete return to the amount of traffic before COVID-19.
Car usage is beginning to exceed pre-pandemic levels
Looking more closely at the government data, across the entirety of the most recent publishing period (Tuesday 12 September 2023 to Monday 9 October 2023), we can see the beginnings of an upward trend in motor traffic levels, exceeding pre-pandemic levels.
Traffic volumes were seen to be fluctuating between 99% and 103% of the levels before COVID as more cars are on Britain’s roads now than since early 2020.
However, these figures only represent weekdays and not weekends or bank holidays. So, while we are confident that cars are used more for work and commuting, it is difficult to determine whether traffic levels are higher or lower for more leisure-based travel.
Public transport remains lower than pre-pandemic levels
When it comes to public transport, however, it seems that the number of bus and rail journeys has not yet returned to how they were before COVID.
Rail passenger journeys for the week ending Sunday the 1st of October 2023 (excluding the Elizabeth Line) were only 78% of those observed in the equivalent week in 2019 before the pandemic hit. This increased to 87% by the 9th of October — and we’ll wait to see if this rises further by the end of the year.
As for bus boarding outside of London, while rates have bounced back much quicker than rail travel, they are still only sitting at 96% of the pre-COVID baseline.

Transport in the nation’s capital remains quieter than before COVID
Looking at London itself, the rates of travel on public transport have not yet fully recovered to pre-pandemic levels either. TfL bus boardings on Friday 6 October 2023 were still just 87% of the equivalent day in 2019 and Tube entries and exits on this day were also just 73% of the 2019 equivalent day.
The Tube has been especially quiet in the publishing period from the 12th of September 2023 to Monday 9th October 2023, dipping down to just 60% of pre-pandemic levels at times.
Pandemic traffic trends explained
It’s safe to say that from employment to leisure and tourism, the world really was turned upside down because of the pandemic. So, it was expected that our roads would experience a similar degree of change, and the following sections begin to unpack why.
Why did motor traffic take so long to return to pre-pandemic levels?
The sudden trend of working from home that came with the pandemic is likely to be the largest factor influencing the delayed return of cars to the roads.
All non-essential workers were encouraged to work from home if possible, furloughed, or simply given time off during this period, meaning that significantly fewer individuals were commuting to and from their place of work each day.
This trend proved popular, with hybrid and remote working becoming more commonplace in the years since the pandemic began. However, in 2023 employers have begun to encourage their workforces to return to the office more and more in a reversal of the previous trend, potentially accounting for increased weekday motor traffic as the daily commute again becomes the norm.
Why is car usage higher than before the pandemic?
There are a handful of potential reasons, one being strikes. In 2023, there were a series of public transport strikes — primarily affecting the rail sector. As such, more and more workers looking for a reliable commute may be resorting to driving in their own cars.
Another affecting factor may be fuel. In 2022, what became known as ‘the fuel crisis’ made the running of motor vehicles extremely expensive. We can see that, in 2022, the average price of petrol was 191.53p per litre in July. However, in the first half of 2023, these sky-high costs began to fall. As of Thursday the 26th of October 2023, the average fuel cost of petrol was 155.1p per litre. People may, in part, be returning to previous levels of driving because of this reduction.
Keep up with the latest motoring trends
If you would like to keep up to date with more of the latest motoring advice, be sure to regularly check the Kwik Fit blog. Or, if you have any questions about your own motor, give the experts at your local Kwik Fit a call — from MOTs to new tyres, we’ve got you covered.
*The data in this blog is based upon the Department for Travel statistics as of Thursday the 2nd of November 2023.
Any facts, figures and prices shown in our blog articles are correct at time of publication.
Featured Articles
Is it Illegal to Drive With One Headlight?
Saturday 19th July 2025
Wondering if it’s illegal to drive with one headlight? Learn about the safety risks and penalties of illegal blown bulbs and why you should fix them promptly.
Air Con in EVs & Hybrids: Experts Answer Your Questions
Monday 30th June 2025
Does air con drain EV batteries? Can you use the air con while charging an electric car? Find out the answers to these questions & more from Kwik Fit’s experts.
Why Is Your Car Making a Noise? Fixes & Tips
Friday 13th June 2025
When your car starts making unexpected noises, it can certainly be quite disconcerting; it may be nothing to worry about, but here’s what you need to know.