The UK's Most Dangerous Roads
Jack Dreyer | Wednesday 6th December 2023 3:00pm
There are thousands of accidents on Great Britain’s roads every year, from minor scrapes to severe collisions — most of which may have been avoided if safer driving practices had been observed.
As road users, it is our duty to drive as responsibly as possible to keep ourselves, our passengers, and those around us safe. And, as a nation, we could definitely improve our road safety. But where in the UK needs the most improvement?
We were keen to find out which of the UK’s roads were the most dangerous and, of course, which areas boasted the safest roads. So, we looked at official government data from the Department of Transport and found out. If you’re curious to see how your area fares, read on.
Factors affecting road safety
Before we get into the statistics, let’s take a look at what makes for safe roads. From road conditions to driver distractions, there are plenty of factors affecting how likely a collision is to occur.
Driver behaviour
One of the largest influencing factors on road safety is driver behaviour. The extent to which the person behind the wheel is in control of the vehicle has significant implications for road safety.
Speed
Speeding or not driving appropriately for the road – that is, going too fast on blind corners and country lanes – hugely increases the likelihood of a collision. Because of this, some modern cars have speed limiters fitted to help keep drivers safe. For one, speeding reduces the time a driver has to react to hazards and external stimuli and, for two, higher speeds make for increased stopping distances, elevated impact severity, and decreased ability to control the car.
As a general rule, it’s wise to remember that speed limits are not targets, merely guidelines and the speed your vehicle is going should always remain appropriate to the condition and type of the road. EG: you should drive slower in wet weather due to the reduced friction and grip on the road.
Distracted or impaired driving
Another factor is driver attention and alertness. Fatigue, being under the influence of drugs or alcohol, and any distractions from within the vehicle (mobile phones, loud music, other passengers) can all increase the likelihood of collisions by diverting the attention of the driver away from the road, reducing the likelihood of them spotting any hazards before they occur.
Road conditions
Aside from what drivers can control about their own behaviour, there are a number of external factors that influence road safety too — namely road conditions and quality.
Weather conditions
We’ve written extensively about how weather conditions have a significant bearing on how easy it is to drive and retain control of your vehicle. Rain, snow, fog, and ice can all create slippery road surfaces and reduce visibility, making driving more hazardous on the whole.
So, where possible wet weather driving best practices should be adhered to, that is:
- Braking in good time
- Using fog lights in low visibility conditions
- Travelling at slower speeds when road surfaces are wet
- Keeping greater distances between you and the car in front.
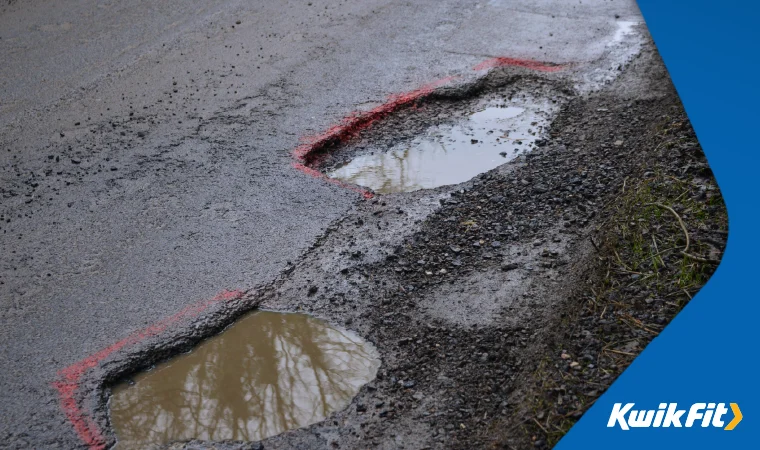
Road quality
Hand in hand with weather conditions comes road quality. Roads with potholes and uneven surfaces can cause damage to vehicles or drivers to swerve onto the wrong side of the road to avoid them. Similarly, a lack of proper signage can also lead to accidents by misleading users.
Vehicle factors
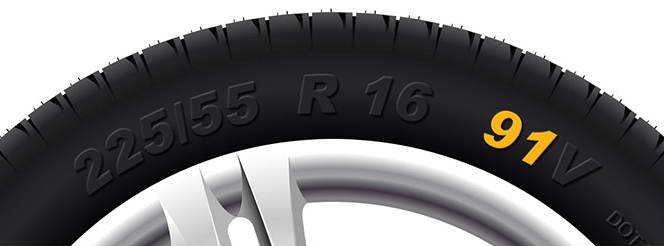
Finally, the condition of the actual vehicles on the road also impacts road safety. Inadequate vehicle maintenance – resulting in faulty brakes or worn-out tyres, for example – increases the risk of unexpected mechanical failures which may catch you and other road users off guard.
Similarly, if your vehicle is not serviced often, certain features you rely on to keep you and your passengers safe may not perform as well as usual — airbags and brakes being two examples. To reduce the risk of unexpected breakdown and potential collision, get your vehicle serviced regularly and replace your tyres and brakes when they begin to wear out.
Bearing all that in mind, then, where in the UK puts it into practice the best — and which areas could use some improvement?
The UK’s safest roads
We looked at reported road collisions (of all severity) by local authorities across Great Britain between 2012 and 2022 to determine which of the counties in the UK had the safest and most dangerous roads. The results are as follows:
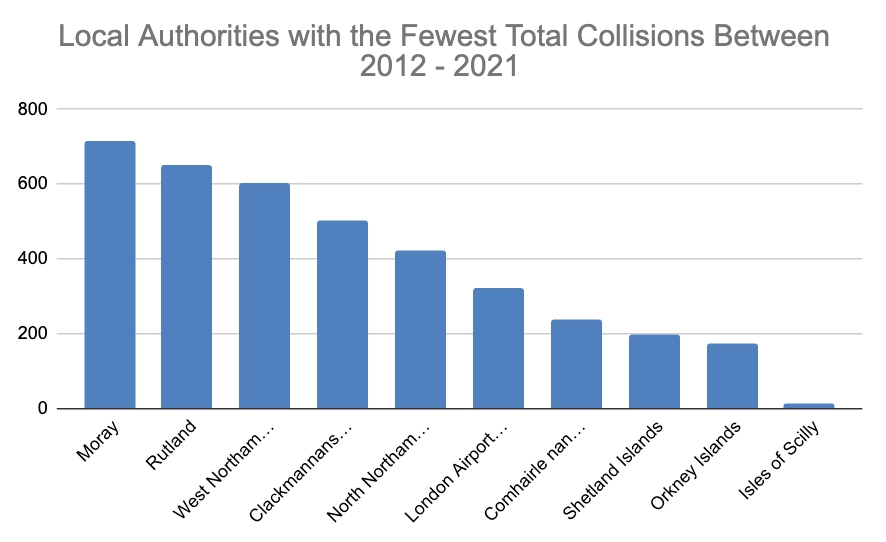
Coming in first place are the Isles of Scilly with a mere 15 collisions between 2012 and 2022. It is important to note that the number of cars on the roads — and the size of the local authorities — do factor in here too. The Orkney Islands and Shetland Islands come in 2nd and 3rd with 182 and 203 total collisions respectively.
The full breakdown can be found in the table below if you are interested.
| Position | Local Authority | Total No. of Collisions Between 2012-22 |
|---|---|---|
| 1 | Isles of Scilly, South West | 15 |
| 2 | Orkney Islands, Scotland | 182 |
| 3 | Shetland Islands, Scotland | 203 |
| 4 | Comhairle nan Eilean Siar, Scotland | 248 |
| 5 | London Airport, Heathrow | 348 |
| 6 | Clackmannanshire, Scotland | 529 |
| 7 | Rutland, Scotland | 675 |
| 8 | Moray, East Midlands | 754 |
| 9 | Blaenau Gwent, Wales | 825 |
| 10 | East Dunbartonshire, Scotland | 834 |
But, at the other end of the scale, what about the most dangerous roads?
The UK’s most dangerous roads
Looking at the data, it seems that the South East reigns supreme when it comes to the most dangerous roads, taking four out of the top ten spots for the most collisions of all severities between 2012 and 2022.
The worst offender is Kent, with an average of 4294 road collisions every year. The neighbouring counties of Surrey and Essex take the 2nd and 3rd spots with 36,498 and 29, 753 collisions respectively.
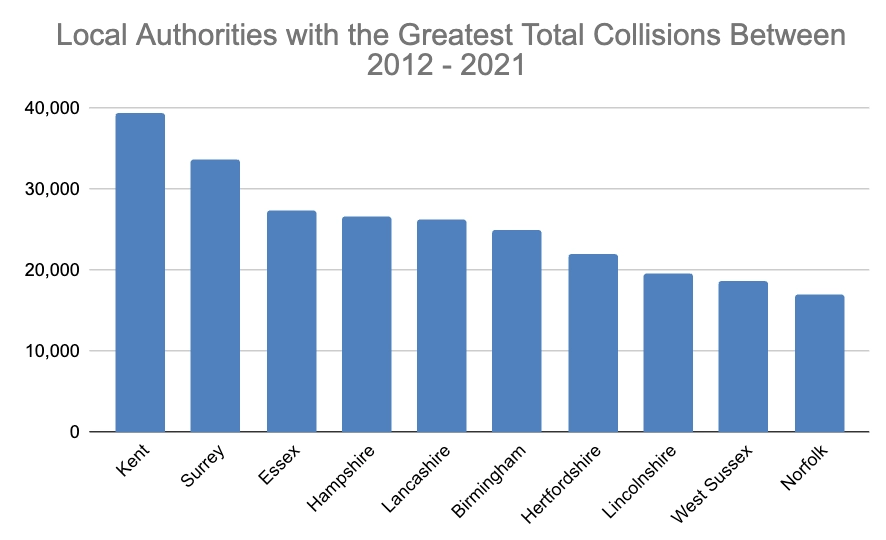
The list is as follows:
| Position | Local Authority | Total No. of Collisions Between 2012-22 |
|---|---|---|
| 1 | Kent, South East | 42.948 |
| 2 | Surrey, South East | 36,498 |
| 3 | Essex, East of England | 29,753 |
| 4 | Hampshire, South East | 28,889 |
| 5 | Lancashire, North West | 28, 498 |
| 6 | Birmingham, West Midlands | 27, 329 |
| 7 | Hertfordshire, East of England | 23, 779 |
| 8 | Lincolnshire, East Midlands | 21, 132 |
| 9 | West Sussex, South East | 20, 598 |
| 10 | Norfolk, East of England | 18, 474 |
Keep yourself safe on the roads
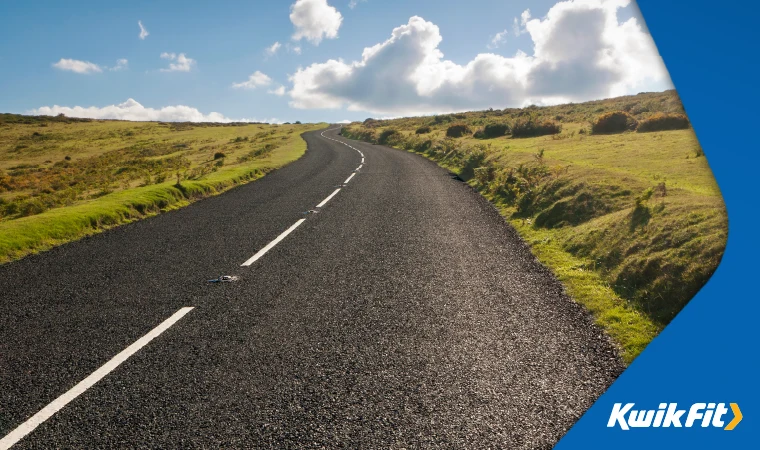
Regardless of where you're driving in the UK – from the busy roads of Kent to the quiet, winding lanes in the Isle of Scilly – remember to drive safely. Follow traffic laws, obey signals and signs, drive at an appropriate speed to the road and weather conditions, and always look out for other road users, pedestrians, and cyclists.
Wondering whether the condition of your vehicle is impairing your ability to drive safely? Get in touch with the experts at your local Kwik Fit today. And, in the meantime, for more motoring advice and information, be sure to keep up with the Kwik Fit blog.
Any facts, figures and prices shown in our blog articles are correct at time of publication.
Featured Articles
Is it Illegal to Drive With One Headlight?
Saturday 19th July 2025

Wondering if it’s illegal to drive with one headlight? Learn about the safety risks and penalties of illegal blown bulbs and why you should fix them promptly.
Air Con in EVs & Hybrids: Experts Answer Your Questions
Monday 30th June 2025

Does air con drain EV batteries? Can you use the air con while charging an electric car? Find out the answers to these questions & more from Kwik Fit’s experts.
Why Is Your Car Making a Noise? Fixes & Tips
Friday 13th June 2025

When your car starts making unexpected noises, it can certainly be quite disconcerting; it may be nothing to worry about, but here’s what you need to know.